Tableau's #Data20 Exhibit Hall - This Week Only!
This year, Tableau’s Annual Conference was hosted online but that doesn’t mean that I didn’t feel full-on chills perusing the virtual gallery featuring the works of 31 incredible data visualization experts that were carefully curated by the Tableau team. I’ll never forget seeing similar works in person at the 2018 Tableau Conference in New Orleans printed and life-sized. But this online gallery has the perk of being available to all of you through the end of this week!
Read More
I Want To Raise The Stakes
So let’s talk about that risk. Where does one’s appetite for risk fit into the financial equations we use for building the optimal portfolio? The way I learned it from Professor Bill Reese at Tulane University, risk appetite can be quantified using a variable “A”, which is formally called “the coefficient of risk aversion.” This coefficient fits perfectly into the following “Utility Function”, which measures the desirability of a particular investment based on its expected return, risk and of course, an individual’s risk appetite.
Read More
Don’t Use COVID As An Excuse
So here’s the thing that’s prime on my mind - not really connected to data science technically, but very relevant to all of us trying to find our footing in this new reality. Lately, I’ve found that a lot of people I know are using COVID-19 as an excuse for saying no to things they don’t want to do.
Read More
On Uncharted Territory...
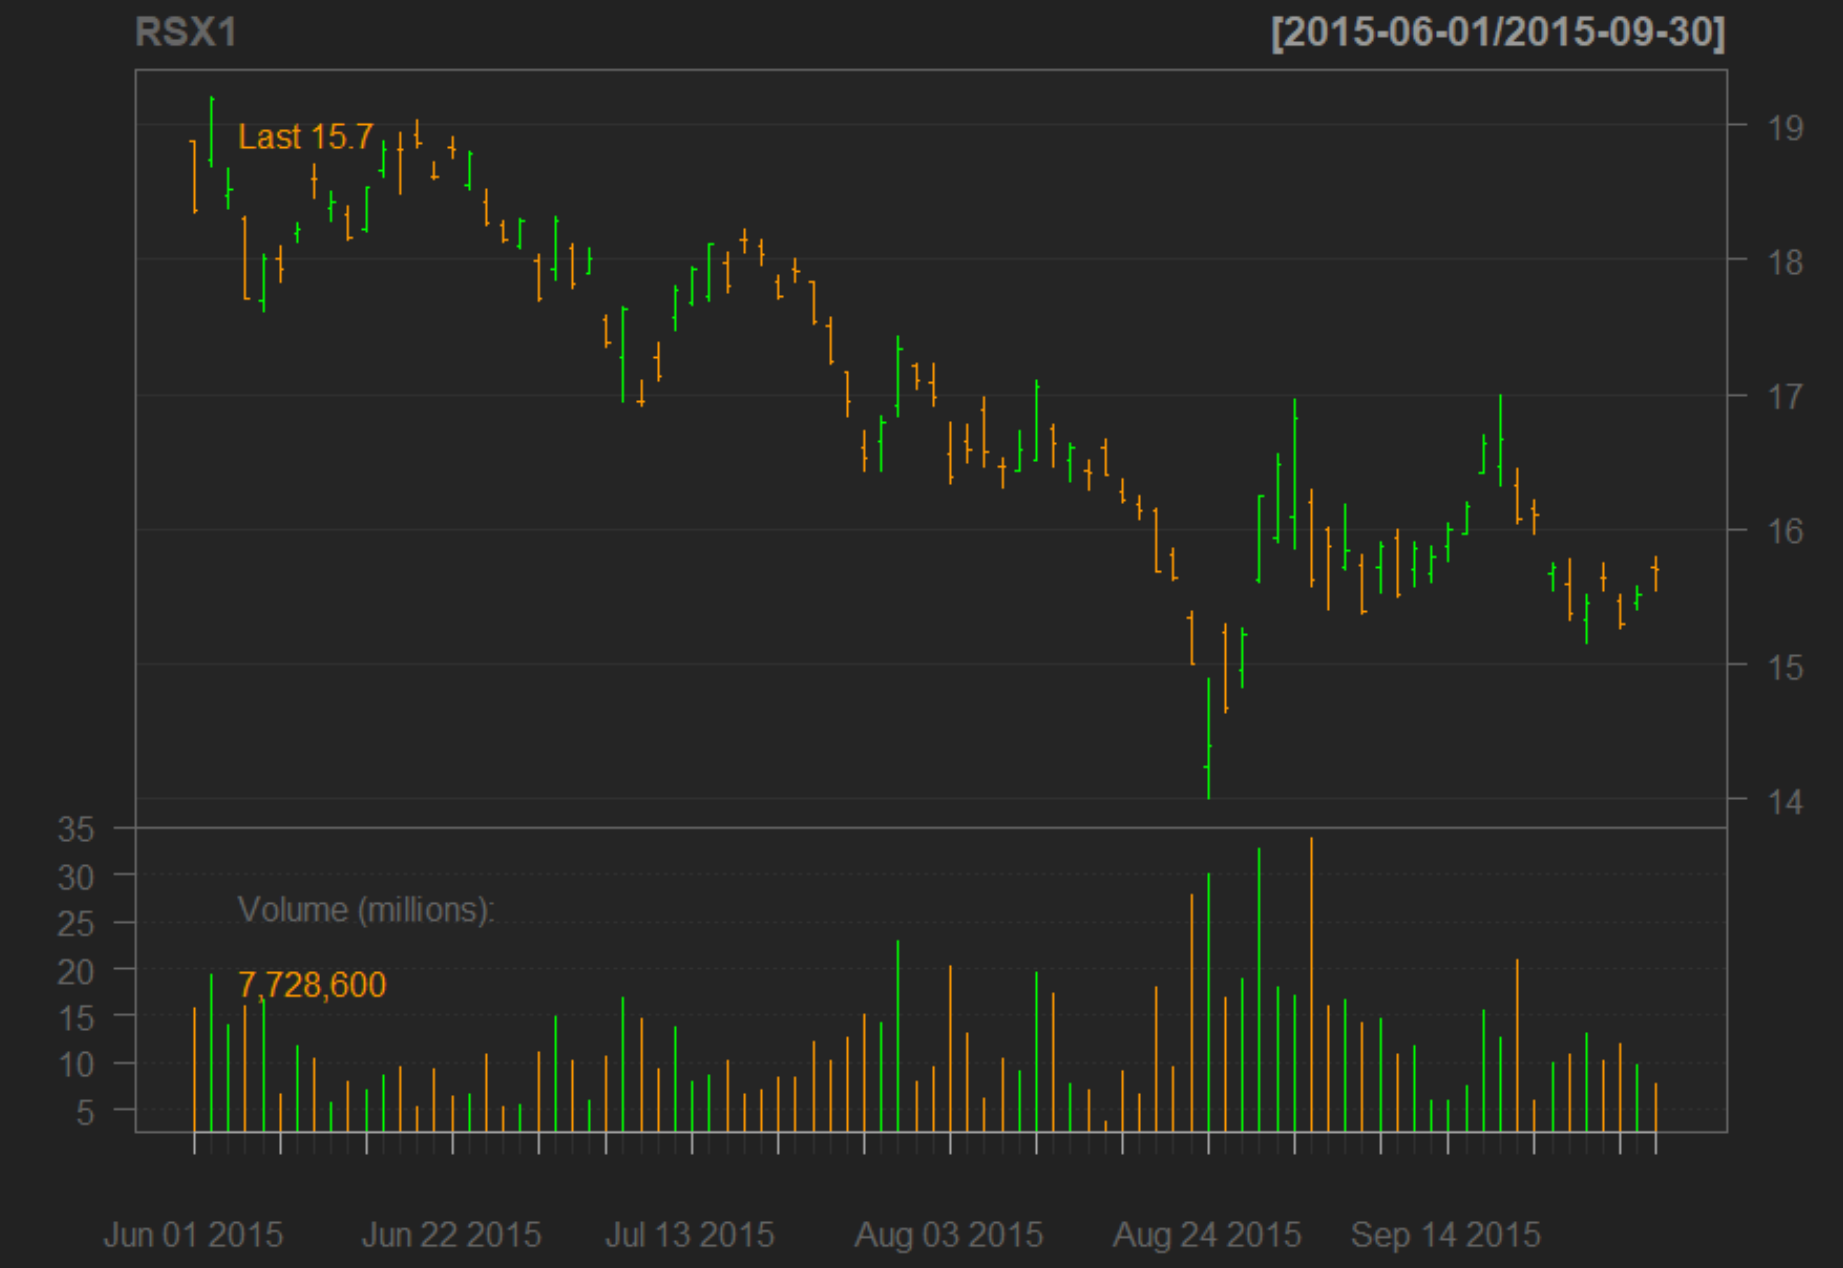
A few months ago, I wrote about the R package “tidyquant” - a streamlined way of pulling stock data and visualizing it in candlesticks like the one below. My background in trading, starting in undergrad, makes experimenting with such packages especially fun. And the best part is: “tidyquant” is not the only R package devoted to processing financial data. There’s also “quantmod”, which I will be writing about today.
Read More
Where There Be Lions
Correct me if I’m wrong, but I’m not sure the standard resume templates we’ve harbored for years cut it in this day and age. Employers, like the rest of us, prioritize efficiency so it’s my belief that they care way more about the “what” in your background than the “where.” I like to package “Projects and Experience” into one category while incorporating “Additional Skills” into the project descriptions. This way, you can highlight all of the languages you know without taking up space in the style section.
Read More
Not the Restaurant in the Quarter
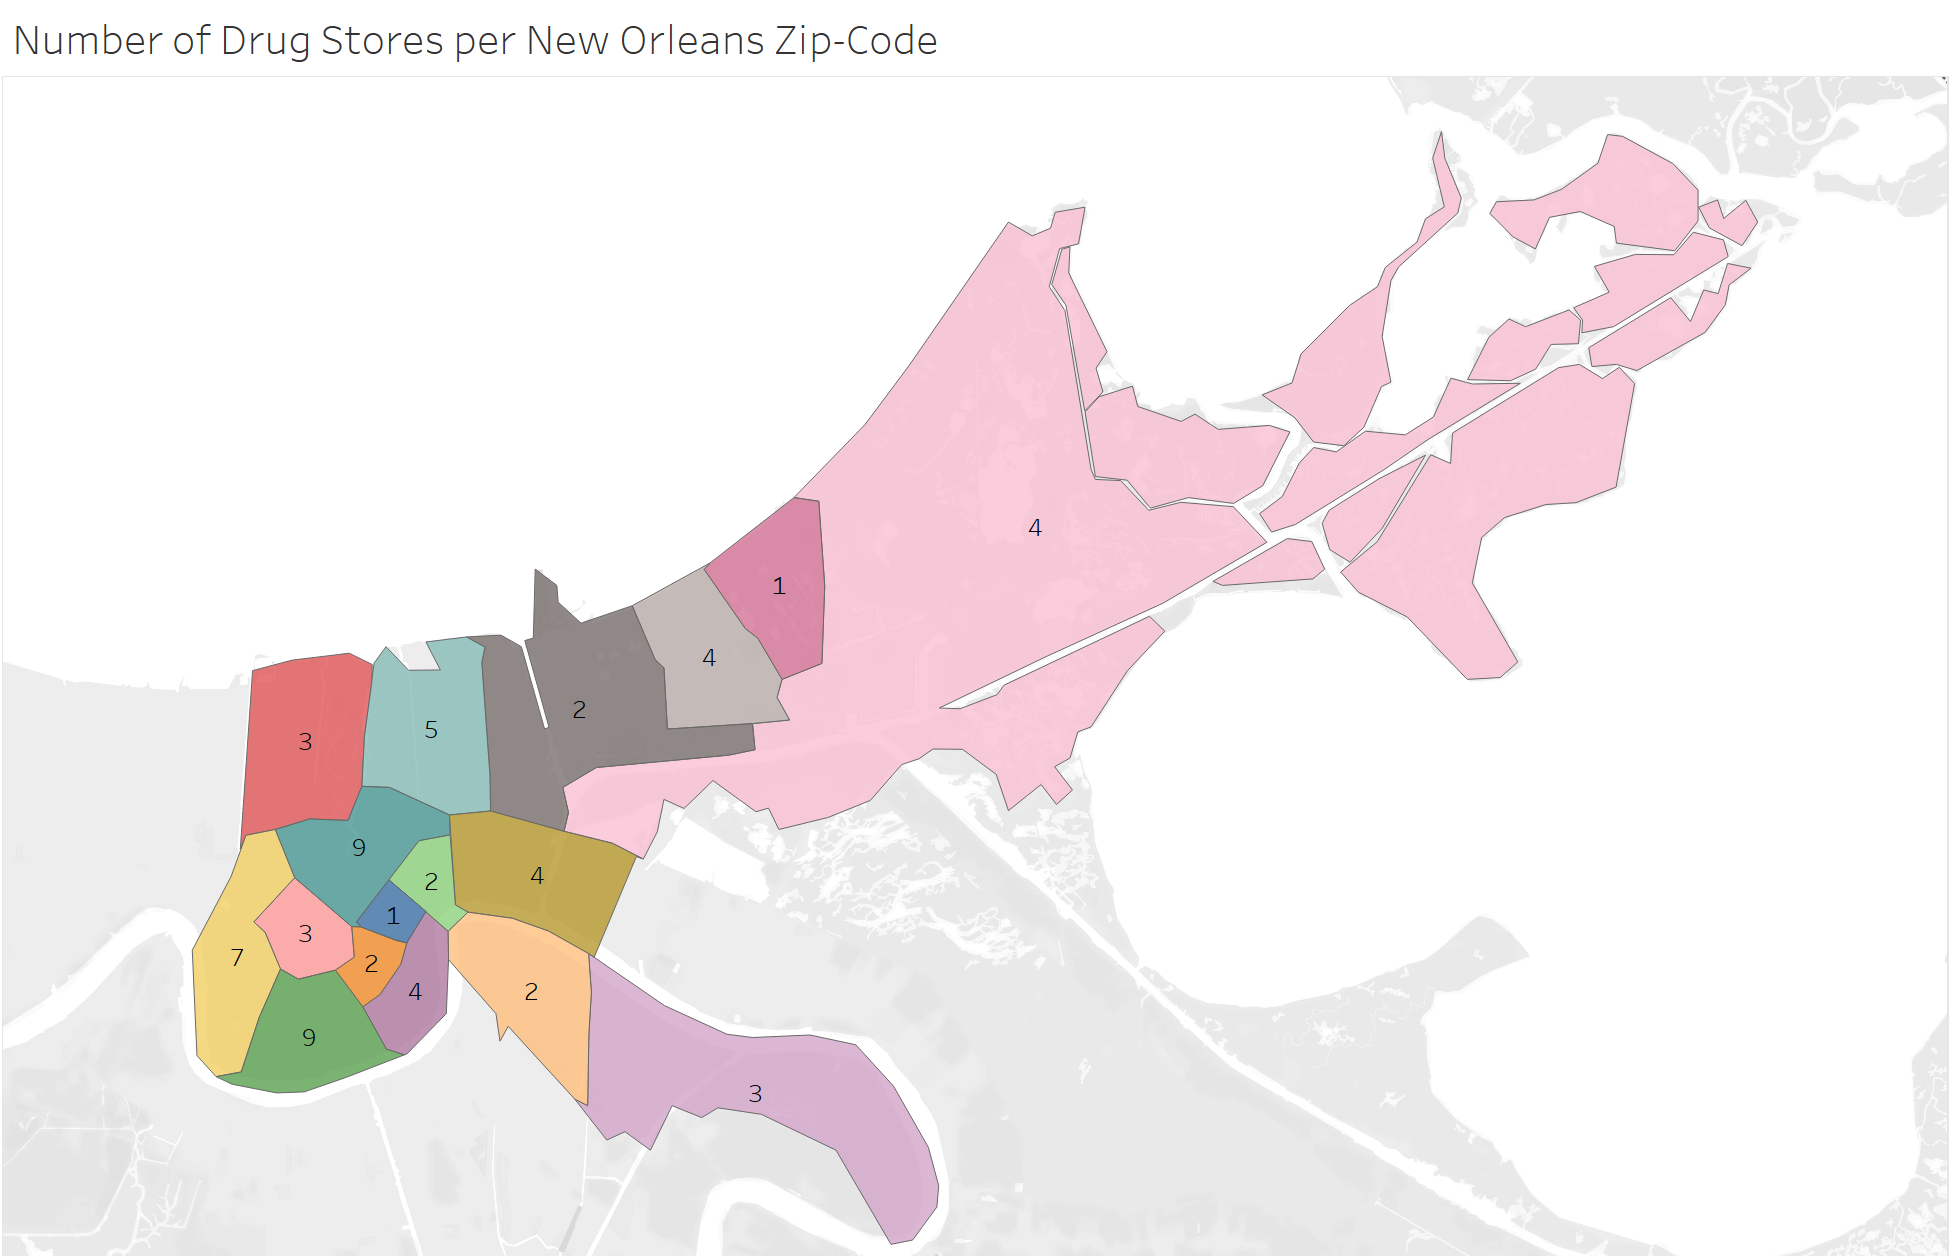
There are many reasons why certain areas of the city have less drug stores than others. One major one is that certain areas, such as the largest light pink block, are primarily made up of swampland and are therefore mostly uninhabited. The other reason is more sinister. New Orleans is notorious for allocating resources to areas of value to tourists while neglecting low-income areas, such as the gray areas on the map.
Read More
Remembering Naya Rivera as a Pioneer for Representation
When I heard that former Glee star Naya Rivera was missing and later confirmed dead, my heart sank. Though touched by the fact that Naya was able to save her four-year-old son as her last living act, I can’t believe that the world has lost such an amazing advocate and force of talent, still living in her prime. Naya Rivera was a pioneer, portraying not only a strong woman of color but also a Queer character with a genuine and meaningful relationship with another bisexual character.
Read More
Introducing: #DataHired Weekly!
I enjoy connecting newcomers to the field to my friends whom I know are interested in mentoring. Often, I’ll find two practitioners of similar levels and interests who might consider partnering on a project now or in the future. But I’ve realized - there’s no need to keep my network stowed away until it’s directly called upon by a given situation. Why not be proactive and regularly share it with you?
Read More
A Sign of the Times: #DataReveal Minisode
#DataFemme is off on a new season so when’s better than now to resume featuring the works of the best and brightest in the data science community? Below are projects from two of my favorite data-viz gurus. Be sure to click the links below each feature to view the whole project and peruse through other projects within their Tableau Public galleries.
Read More
Change Who's Boss - If Not Your Loss...
In 2014, the percentage of Black and Latinx technical employees at Apple was 6%. And guess what? In 2020, it’s still 6%. So what can we do to place Black and Brown technologists in places of real power? Most tech experts within the #DataEveryone community believe that companies’ “Diversity & Inclusion” are not the answer.
Read More
Say You Care, Say It Now
If you choose to stay silent with your Black friends, you may think that you’re being courteous by showing support without making any assumptions about their feelings. But we are past that. Even if you think that your Black friends and colleagues know that you support them, do not take that for granted. Voice your support to the people that matter to you individually and do it now.
Read More
Wrapping To Stay Relevant
It’s wrong to think that we as data scientists, in a growing industry, will not be impacted by this pandemic. And while we don’t know to what extent, there are still many steps we can take to uphold our value and as a result, our security in the workforce. This week’s #DataEveryone chat provided a medium for industry novices and experts alike to express their opinions on this topic.
Read More
The Tidiest Tuesday
This week, I’ve come to know about a package that’s main purpose is to make it easier to carry out the Tidy Tuesday challenge in one place. Written by Ellis Hughes, the “tidytuesdayR” package pulls the datasets needed for each Tidy Tuesday challenge into your RStudio environment in just a few quick steps.
Read More
To Spark a Reaction
Are Phase I resolutions a thing? If they weren’t, there are now. Because my Phase I resolution is to become more organized. Not only in terms my house or my business plans, but with my data. So when I saw my friend Thomas Mock post on LinkedIn about the package “Reactable,” I was inspired to check some features out.
Read More
3 Takeaways from #DataFemme Season One
So as some of you know, I wrapped up recording for #DataFemme Season One today. I can’t wait to release the Season Finale of #DataFemme featuring Senior Developer at Small Planet, Quinn McHenry, on Friday. It will be followed by a special bonus episode as you eagerly await Season Two.
So as you inevitably give into your curiosity and listen to all the Season One episodes you missed, here’s three main things that I’d want you to take away from #DataFemme’s first season.
Read More
With and Without You
Lately, I have been tutoring a college student in econometrics. Her assignments require her to analyze statistical concepts and simulate them in STATA and R. The other day, she asked me about interpreting interactions in her regressions. Isn’t it a bit redundant to include a female term, a place of residence term and a female*place of residence term?
Not exactly. And here’s why:
Read More
Stitching Functions and Packaging Patterns
Some of you within the data science community may know I’m a knitter, because many of you are as well. There are many comparisons between knitting and coding, but I’ll only mention three. And if you’re not a knitter, I imagine you’ll still find that these parallels exist between coding and the hobbies you have chosen.
Read More
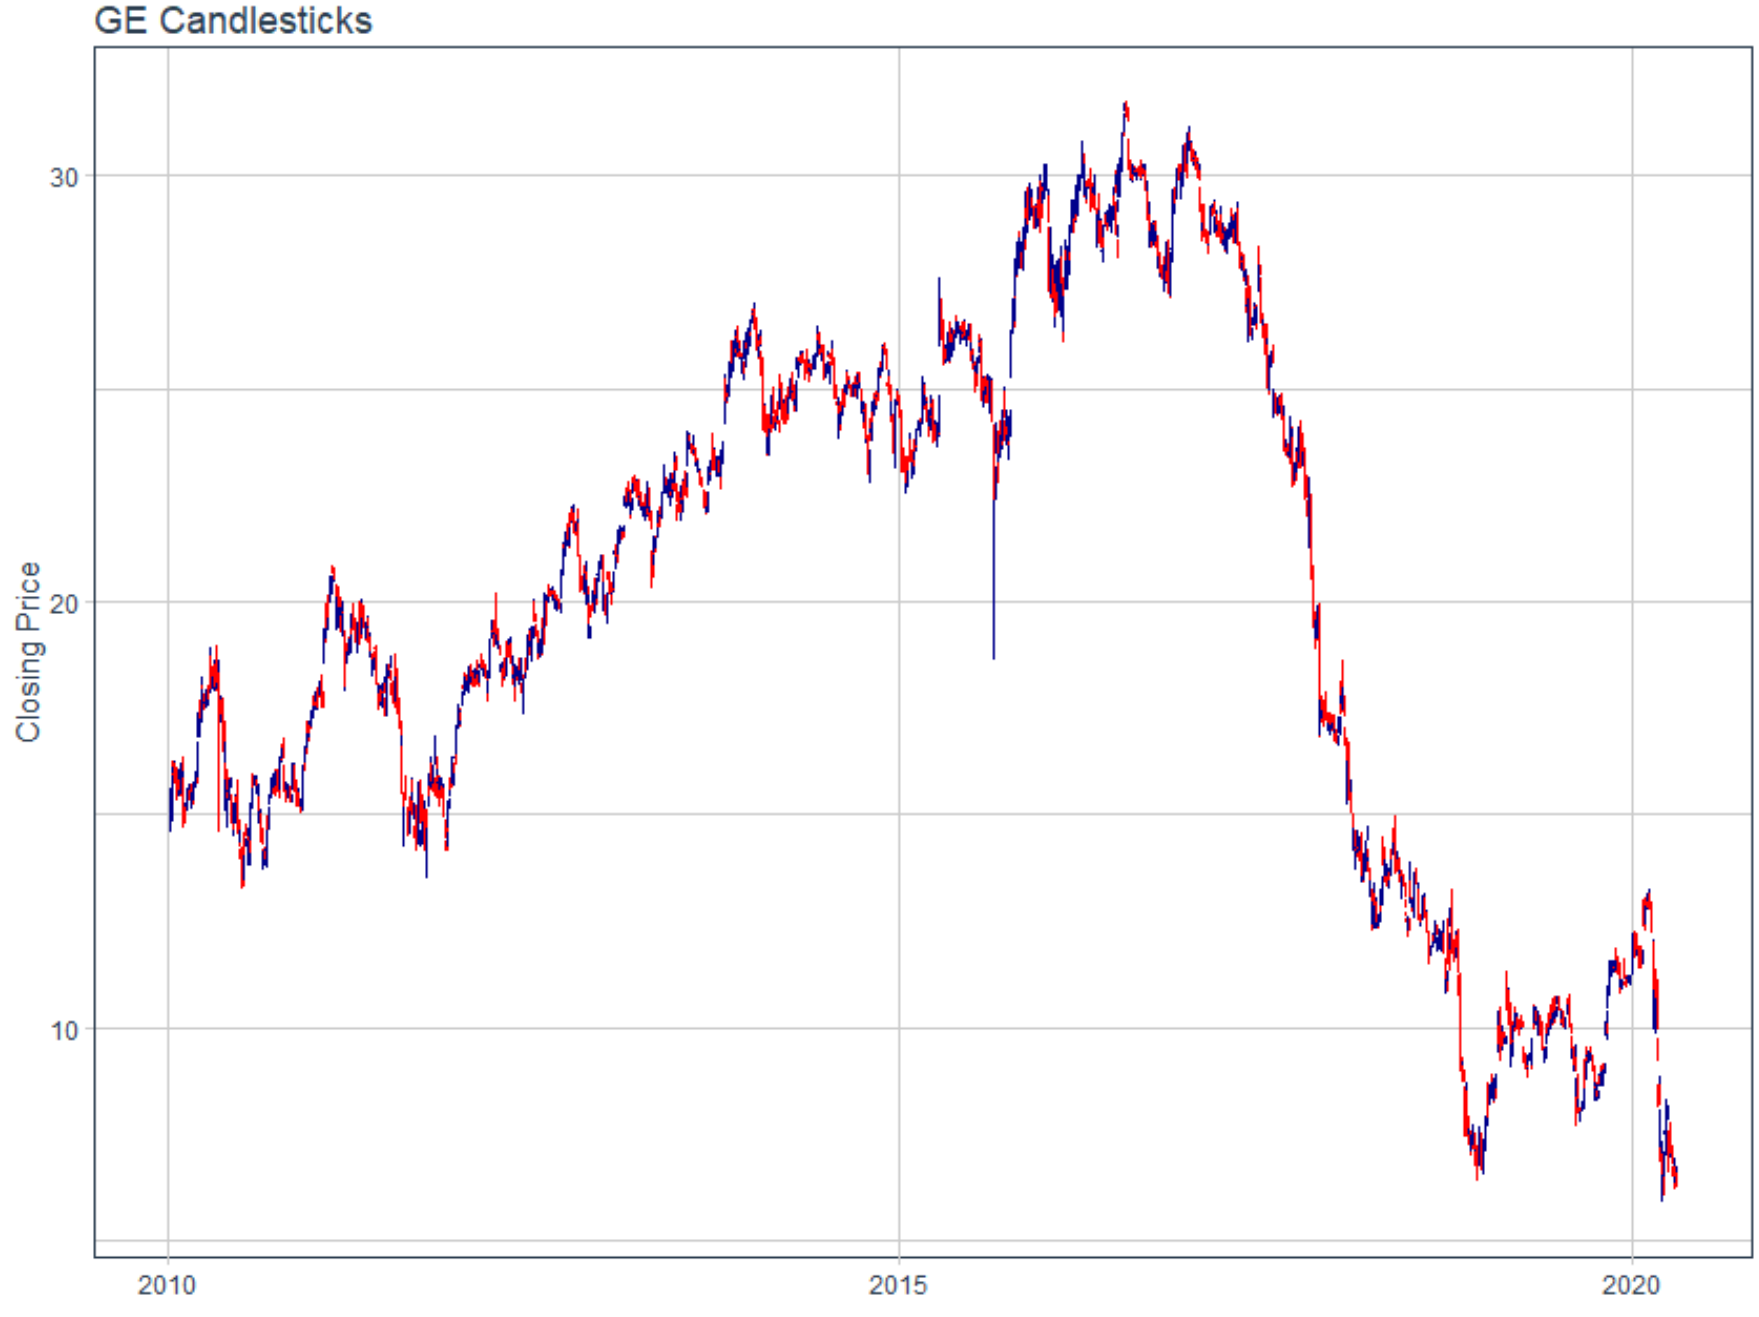
My Stock in Tidyquant
In my business school Investments course, we used macros in Excel to pull Yahoo Finance data and simulate portfolios. No stranger to trading, but new to macros, I thought it was the coolest thing. But, as usual, anything Excel can do R can do better, as proven by my new favorite package: “tidyquant.”
Read More
I'm in it for the Long Haul
How can we motivate ourselves to prioritize our finances in situations where full recovery is hard to grasp? In the wise words of Angel in Buffy the Vampire Slayer, “We don’t fight to win. We fight because there’s something worth fighting for.” And financial stability? That’s worth fighting for.
Read More
Noodles, Code and Company
Not all of us have the privilege of quitting our consulting jobs and jetting off to Italy to play chef (taken from a true story), but that doesn’t mean we can’t roll out handmade pasta in our kitchens. And if that task seems too outside the realm of possibility, there’s a package in R called “datapasta” that’s calling all of our names.
Read More