Talking Shop: December's #DataReveal
The stereotype of the lone data scientist sitting behind a computer in the dark may have some truth to it. But lately, initiatives like Tableau’s #MakeoverMonday and RStudio’s #TidyTuesday have created a consistent culture around the importance of sharing our work with one another - both for feedback and validation. That’s why we at Dikayo Data have made it our mission through #DataReveal to compile the best of the data community’s projects monthly on our site, centered around a theme. This week’s is e-commerce.
For When One Day You’re In and the Next You’re Out
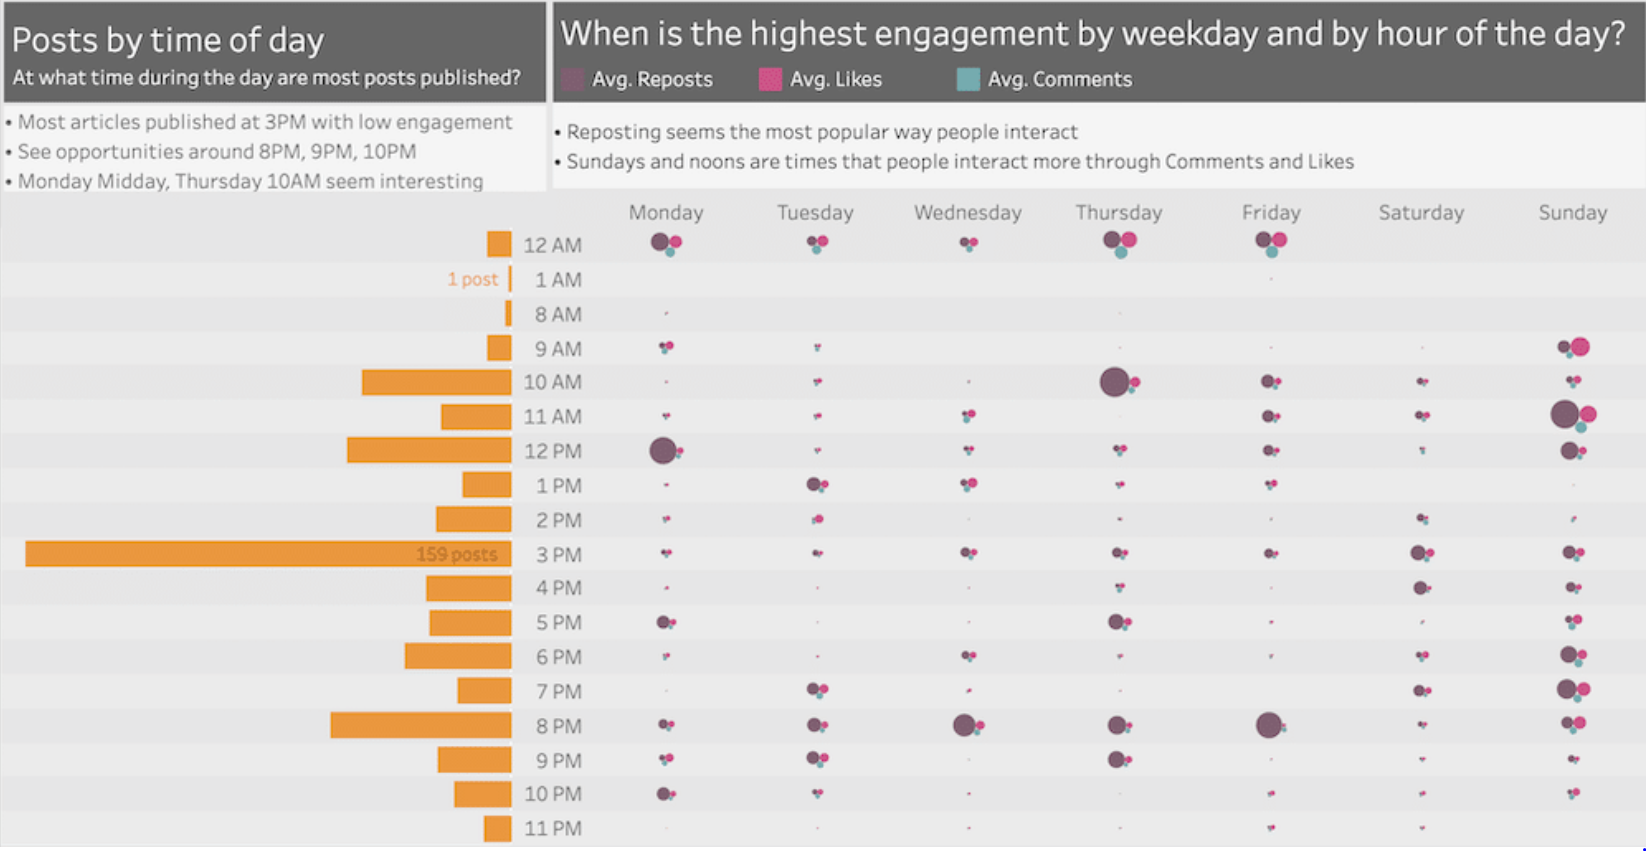
The Chinese market is extremely volatile in the sense that a briefly passing holiday such as “Singles’ Day” can cause a world of change in e-commerce sales patterns. The analysis that @canonicalizedco did through Tableau aggregates this data to help businesses predict the spikes and lows they might experience.
Twitter: @canonicalizedco
Describe your project in 1 sentence/your elevator pitch.: The visualization below is a part of a client project we did for Chaoly, a company that helps eCommerce businesses with insights on their Chinese market strategy.
Here you can find the complete inside scoop and the full gallery of dashboards.
What motivated you to do this project?: There’s no market like the Chinese one! Having the chance to work with Tableau on such datasets is definitely a challenge. I am a sucker for a good challenge, so we went for it!
What is the main takeaway you want viewers of your project to have? : There is a long way to go from building charts for the sake of building charts to answering questions.
There’s a lot more to these dashboards than drawing pictures. These are a result of hard work starting with analysis, sense-making, and visualization.
What was the most challenging part of crafting this code?: Blending all the different datasets together in a cohesive way
What is your favorite package within your language of choice?: My favourite Tableau features we got to use in this project are Set Actions (for interactivity) and Data Blending (pre-aggregated joins)
What do you hope to use your data science skills for in the future?: I hope to use them to help data-driven people do more of what they love! Whether that is answering more questions for them and their organizations, or help them gain more free time.
To Place Your Eggs in One Basket
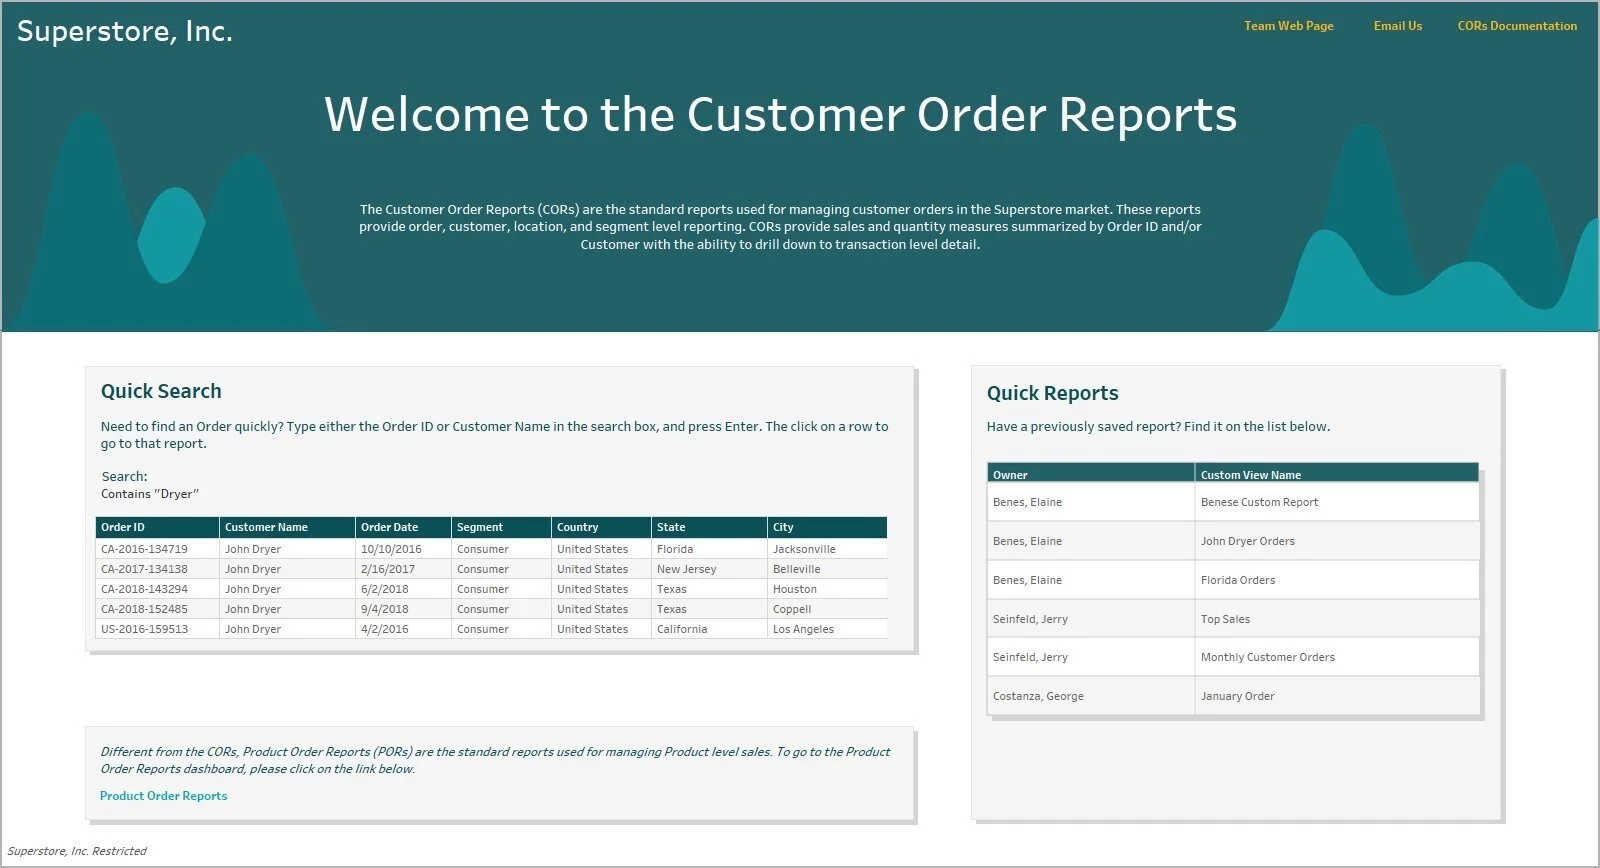
@ReadySetData’s Landing Page, made in Tableau, introduces businesses to their customer’s data with a streamlined overview, preparing them to deep dive into the specifics.
Twitter: @ReadySetData
Describe your project in 1 sentence/your elevator pitch.: I wanted to create a way to welcome users to the data they are about to explore - enter the Landing Page.
What motivated you to do this project?: At work, we were working with several different dashboard all looking at different cuts of similar data, but there was no starting point. There was nothing welcoming the user to the data or explaining what they would fine. Creating a landing page is a nice way to easy the user into the group of dashboards. IT can provide them with definitions. a help link, documentation, or just general information.
What is the main takeaway you want viewers of your project to have? : The user experiences is one of the most important parts in data visualization; capturing their gaze or making them feel comfortable with the data
What was the most challenging part of crafting this code?: The most challenging part for me was designing the viz in Tableau. I wanted something that looked sleek and exciting, but also professional and simple to understand.
What is your favorite package within your language of choice?: Tableau
What do you hope to use your data science skills for in the future?: I'd like to use more data science skills when visualizing in Tableau.
For Chasing Your Charizard
Even if you never traded Pokemon cards in the playground growing up, you know about the franchise. And if you want to examine how your favorite fantasy franchises have developed in popularity since their inception, @MYMRockMama has you covered.
Twitter: @MYMRockMama
Describe your project in 1 sentence/your elevator pitch.: This project was built keeping in mind 'Pictures tells the story of thousand words' Except that it's animated so it tells ten thousand words.
What motivated you to do this project?: I host my own webpage where I post work to motivate beginners to get into advanced analytics and visualization
@vaibhavsingh.netlify.com, this is one of the biggest motivation for me. Huge motivation and inspiration are #rstats and #tidytuesday as well.
What is the main takeaway you want viewers of your project to have? : Try to observe how big franchise like Hello Kitty and Pokemon are when compared to stuff like MCU, DCU etc.
What was the most challenging part of crafting this code?: This was the first time I was trying to work on advanced animation, hence a lot of things came up for first time & definitely when something doesn't have results on Google, you know it's going to a challenge
What is your favorite package within your language of choice?: I am a big fan of #tidyverse and #janitor. Lately I saw reactable package and that's pretty cool too.
What do you hope to use your data science skills for in the future?: To keep teaching and spreading awareness about new tools like R, tableau etc. Unfortunately, a lot of pedagogy in colleges still believes that Excel filter+Pivot= Data analysis, which it's not.
My aim is for each student/professional to be self sufficient and be able to work on his own Data himself/herself.
To Where it’s Needed Most
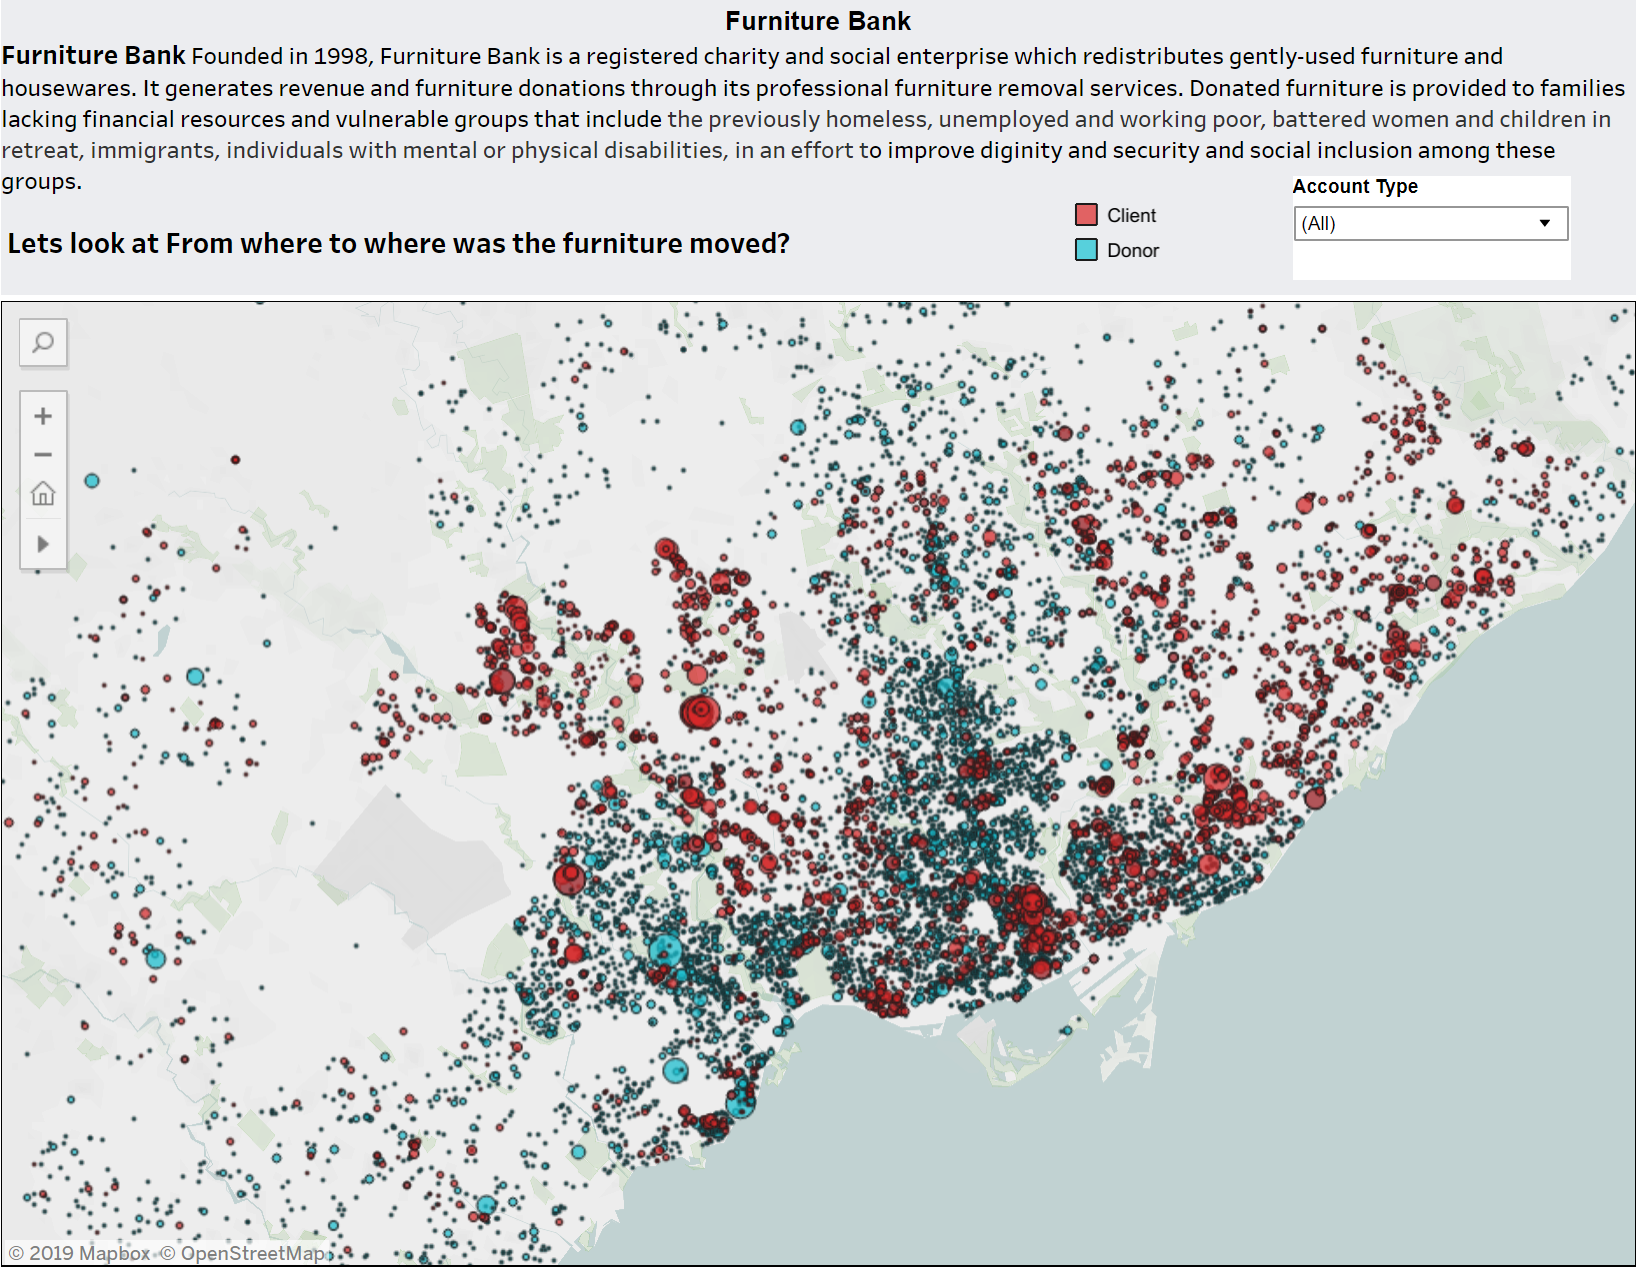
You’d never know that the visualization below was @meghashreekais1’s first venture into Tableau. She used the program in its finest to detail the extent to which Furniture Bank can reach populations that might not have their needs met otherwise.
Twitter: @meghashreekais1
Describe your project in 1 sentence/your elevator pitch.: Impact of a simple act of kindness is beyond what is apparent and its effect on world at large is bigger than one generally would assume.
What motivated you to do this project?: The topic is something very close to my heart and I was highly impressed with the magnanimity of the idea of meeting needs of special groups and impacting the environment at the same time. The moment I read it knew how to tell a beautiful data story out of it
What is the main takeaway you want viewers of your project to have? : I want the viewers to be inspired to take responsibility to care for not just their loved ones and fellow humans but to care for our planet. And most importantly it is not hard or does not necessarily require one to go out all the way to accomplish it.
For example, donating furniture to people in need may not make it apparent to donators of the ripple effect they are creating. In this case apart from promoting dignity and inclusion, they creating employments opportunities, promoting circular economy and better waste management and reducing carbon foot print.
Spreading the effects and impacts of our deeds is necessary to inspire more people to take action. Once inspired one can act in ways no one can imagine to make life more beautiful. I did like to encourage one to share insights even when they think it is trivial.
What was the most challenging part of crafting this code?: sure, we do have data with us which can be summarised or presented in numerous ways. The challenge is to make it precise and concise and at the same time be able to communicate core message with out loosing the subtle meaning or the readers interest.
What is your favorite package within your language of choice?:
What do you hope to use your data science skills for in the future?: I believe data is for everybody for every day life. With my data science skills I want to be able to tell more data stories the makes every day life interesting to everybody and help to understand and reflect on what we are doing and how/what we can do better.
Like What You See?
Keep an eye on our #DataReveal page around the turn of the month or our Twitter @DikayoData to see the next theme a month before submissions! We want to feature your work and encourage you to improve your skills around a topic that interests you.


